Multi-Site Retail Video Analytics Dashboard Guide
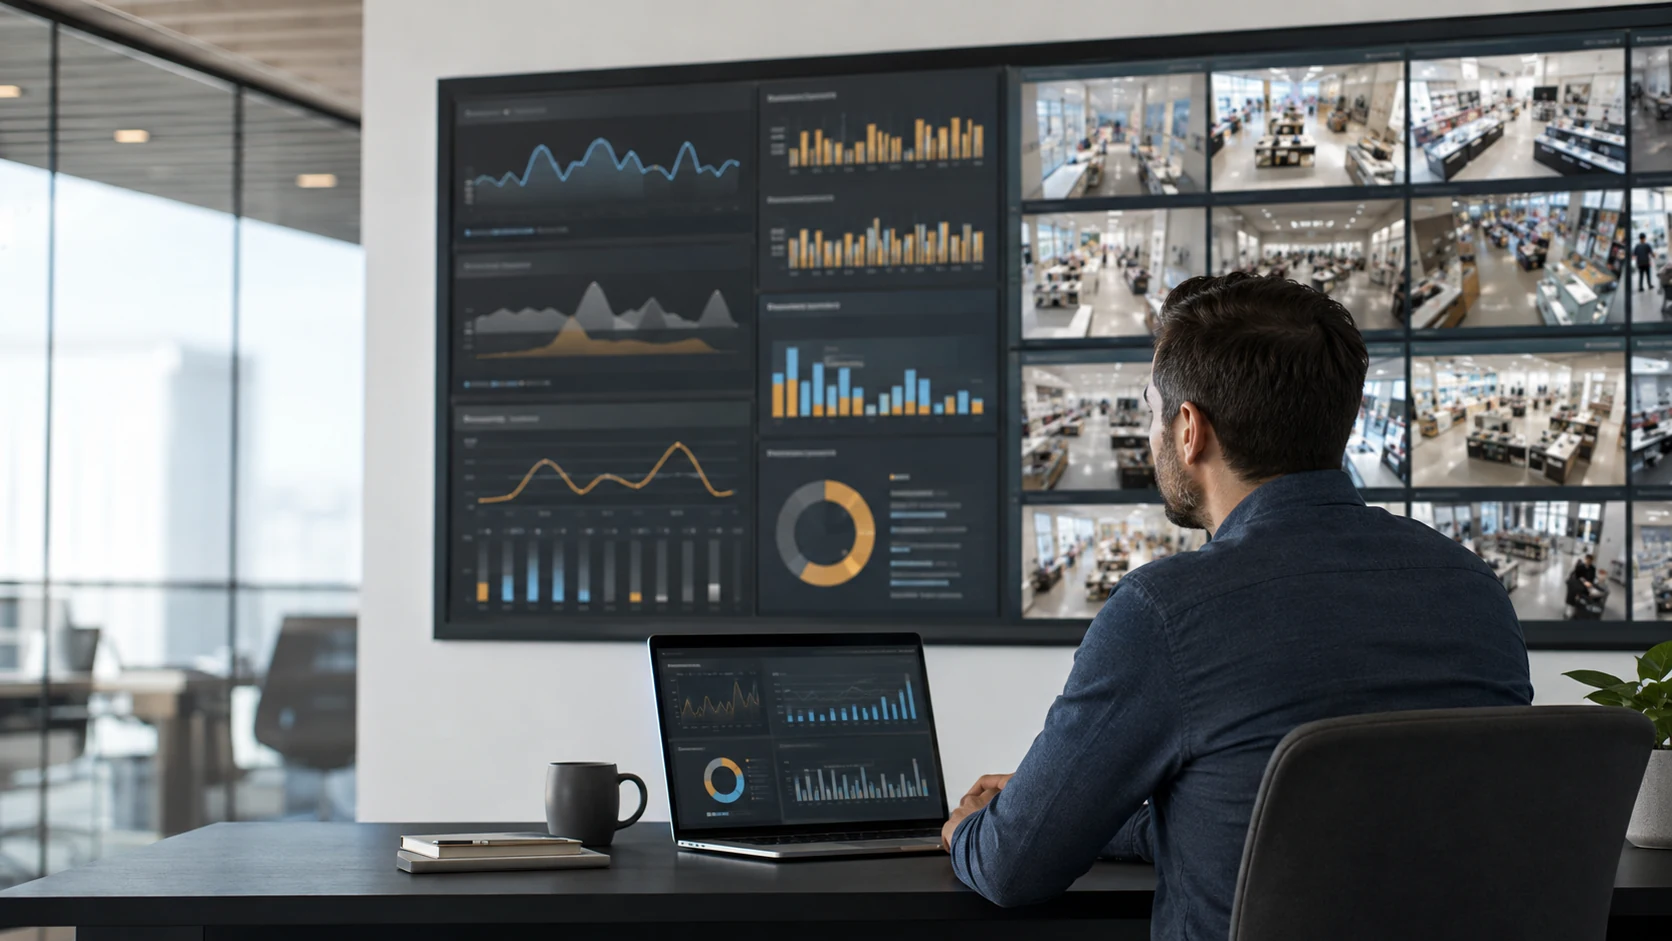
A multi-site retail video analytics dashboard should turn camera events from several stores into decisions that a regional manager, store lead, or security owner can act on. The useful version shows what is happening at each site, highlights meaningful differences between locations, lets a user drill back to the relevant zone or event, and makes camera or data gaps visible. A wall of tiles is not enough: the dashboard needs a clear path from signal to owner to response.
This guide explains what to compare when you are evaluating a platform for existing retail cameras, how to scope a first multi-site pilot, and where integration, privacy, and camera-fit questions can change the buying decision.
What should a multi-site retail video analytics dashboard show?
Start with the operating questions, not the vendor's feature list. A useful multi-site retail video analytics dashboard normally needs four layers:
| Layer | What the buyer should see | Decision it supports |
|---|---|---|
| Network view | Sites with current footfall, occupancy, queue, alert, or service-health signals | Which location needs attention first? |
| Regional or peer view | Comparable stores grouped by format, geography, or trading pattern | Which stores are outliers, and what should be investigated? |
| Site view | Camera groups, zones, trends, alerts, and recent events for one store | Is the issue demand, layout, staffing, camera coverage, or response? |
| Evidence view | The event, timestamp, zone, optional snapshot, and related context | Can the manager verify the signal before acting? |
The exact metrics depend on the camera view and the configured workflow. Footfall is useful at an entrance, queue length at a checkout or service counter, dwell in a product or seating zone, and restricted-area events at a stockroom or staff door. Do not compare stores using a metric that one location cannot measure consistently.
Which retail metrics are worth rolling up across stores?
Choose a small set that maps to an operating decision. Five practical starting signals are:
- Footfall by daypart: compare visitor patterns and staffing coverage at similar stores.
- Queue length or wait pressure: identify service bottlenecks before they become a customer-experience complaint.
- Occupancy: see whether a site is unusually full, unusually quiet, or outside its expected pattern.
- Dwell or zone activity: find areas where shoppers pause, cluster, or move through without engaging.
- Camera and alert health: distinguish a real operating change from a missing stream, offline camera, or misconfigured zone.
The roll-up is only as good as its definitions. If one store counts an entrance while another counts a broader lobby, the comparison is not fair. Keep the camera view, line or zone, time window, and metric definition alongside the headline number.
How do you compare multi-site analytics platforms?
Use these questions during a demo or technical review:
| Buyer question | What a credible answer includes |
|---|---|
| Can it use our current cameras? | Supported IP/RTSP paths, stream requirements, camera-fit limits, and a way to test a real view before rollout |
| Can managers move from network to site to zone? | Location grouping, role-appropriate views, filters, and event-level drill-down rather than a single aggregate score |
| What happens when a camera or site is unavailable? | Camera health, last-seen or service-health context, and a visible distinction between zero activity and missing data |
| Where is video processed? | A clear explanation of edge, cloud, or hybrid processing, including what leaves the premises and what is retained |
| Can we start with a few sites? | A bounded pilot that does not require connecting the entire estate before the first useful answer |
| Which integrations are live? | A named, documented connector or export path; “works with POS” should not be treated as proof of a live integration |
This last question prevents an expensive category mistake. A dashboard can be useful with camera-derived operational signals alone. POS, workforce, inventory, and access-control data can add context, but each connection should be verified for the exact vendor, version, permissions, and data fields involved.
What should a first multi-site retail pilot look like?
Keep the pilot small enough that store teams can judge it and technical teams can fix camera-fit issues. A practical sequence is:
- Select two or three representative sites. Include different layouts, traffic patterns, or camera generations instead of choosing only the easiest store.
- Choose one or two views per site. Start with an entrance, checkout, service counter, or restricted zone tied to a named operating decision.
- Write the response rule. For example: if queue pressure persists during a trading period, the shift lead checks staffing and opens the next available service point.
- Record the camera conditions. Note angle, lighting, occlusion, stream stability, and the times when the signal matters.
- Review the same fields across every site. Compare data completeness, event usefulness, response ownership, and the effort required to keep the workflow running.
Do not call the pilot successful because a dashboard populated. Success means the team can explain what the signal means, identify the responsible person, and make a decision that was previously delayed or based on guesswork. A failed camera-fit test is useful evidence too: it tells you whether to reposition a camera, narrow the use case, or choose a different sensor.
How should you measure value without inventing ROI?
Start with observable measures rather than a promised percentage. Track:
- the number of usable hours or intervals with complete camera data;
- event counts that the store team considers relevant;
- queue, occupancy, footfall, or dwell trends against the same store's prior baseline;
- alerts reviewed and the proportion that led to a recorded response;
- time spent checking footage or reconciling store differences before and after the pilot.
If transaction data is available, keep it separate from the camera measurement unless the exact integration is verified. For a simple illustrative comparison, a store with 140 counted visits and 28 transactions has a transaction-to-visit ratio of 20% for that period. That ratio is context, not proof that cameras caused a result; queue wait, promotions, stock, staff coverage, and counting quality can all affect it.
What privacy questions matter for UK, US, and European retailers?
Ask whether the operating question needs identity at all. Footfall, occupancy, queue pressure, dwell, and restricted-zone events can often be evaluated without facial recognition or identity matching. Document the purpose, access controls, retention, signage, and any impact assessment required for the deployment.
For UK and European teams, the Information Commissioner's Office guidance on video surveillance is a useful starting point for accountability, transparency, lawful basis, and proportionality. Local video processing can reduce the need to send continuous raw footage to a remote service, but it does not automatically make a use lawful or remove the operator's responsibilities.
How does Horus fit an existing-camera multi-site rollout?
Horus is designed for compatible IP/RTSP cameras connected to a Windows PC on the premises. The Edge Agent performs video inference locally, while the web dashboard receives operational metadata such as events, counts, alerts, and service-health information. Optional alert snapshots can be stored; continuous raw video is not required for the standard workflow.
The current capability set includes multi-site management, camera grouping by location or purpose, real-time analytics, searchable and filterable alerts, CSV/JSON alert export, and a mobile-responsive dashboard. Retail workflows include foot traffic, queue length, wait-time estimation, occupancy, dwell, and heatmap analysis. Camera angle, lighting, stream access, local compute, and zone configuration still determine whether a particular view is useful.
Horus is not a substitute for checking every connector. CCTV/VMS integration is a verify-before-buy boundary, and a POS or ERP relationship should be confirmed for the exact system and data path. If you need a partner-led rollout, review the Horus partner programme separately from the camera analytics evaluation.
For the underlying security and operations layer, see the security camera analytics platform guide. For entrance, queue, and store-traffic measurement, see retail footfall analytics from CCTV.
Is a multi-site dashboard the right next step?
Choose one when you have several locations, a repeated operating question, and enough consistency to compare like with like. Hold off when the first store cannot produce a stable stream, the metric has no response owner, or the organisation has not decided what data can be retained and who can access it.
The best buying sequence is simple: define the decision, test the camera view, verify the processing model, run a small cross-site pilot, and expand only when the signal is repeatable. A multi-site retail video analytics dashboard earns its place when it reduces the distance between a camera event and the manager who can act on it.
Start your 14-day trial with a compatible camera and test one measurable workflow before expanding across the estate.
Sources
- BriefCam: Multi-Site Video Analytics — public example of per-store alerts and aggregated multi-store trend views.
- Slinai: Multi-Site Video Oversight — public example of site hierarchy, benchmarking, and camera-health questions.
- Slinai: Multi-Site Video Dashboard — public example of regional scorecards, site health, and drill-down requirements.
- Information Commissioner's Office: Video surveillance, including guidance for organisations using CCTV — UK guidance on accountability, transparency, lawful basis, and proportionate surveillance use.